

CryptoQuant is looking at a pattern that can help newer Bitcoin buyers make sense of rough market phases. In past US midterm election years, Bitcoin often lost ground before the vote, then recovered in the year that followed. For anyone trying to understand why Bitcoin can fall hard and then climb back, that history gives us a useful framework.
Good to Know
- CryptoQuant says Bitcoin fell more than 60% on average in past US midterm election years.
- In the 12 months after those weak periods, Bitcoin rose more than 50% on average.
- Lower liquidity, fewer active buyers, and political uncertainty often show up together in these cycles.
Bitcoin Struggles in a Midterm Election Year
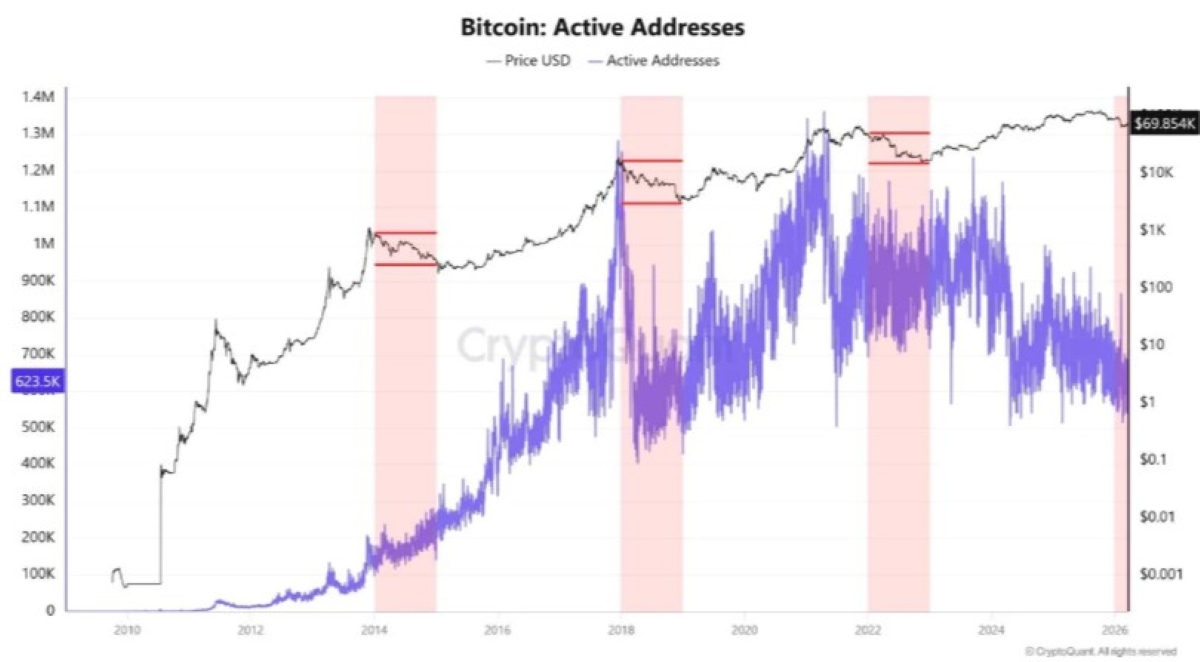
CryptoQuant points to three past US midterm years, 2014, 2018, and 2022. In each case, Bitcoin went through a deep pullback before conditions improved later on. Average decline came in above 60%, which is a reminder that Bitcoin can be a very volatile asset. Volatile simply means price can swing up or down fast.
For newer readers, one part matters more than anything else. Price weakness did not happen in isolation. Election-year uncertainty often pushes investors to take less risk. When that happens, people trim positions, trading activity cools off, and market liquidity gets thinner. Liquidity is just a simple way of saying how easily money moves in and out of an asset without causing large price swings.
That setup can hit Bitcoin harder than many other assets. If fewer buyers are around, even modest selling pressure can drag price lower. On-chain data backs that up. Active addresses usually fall into election periods, which suggests lower participation and weaker demand. On-chain data refers to information pulled from the Bitcoin blockchain itself, like wallet activity and transaction patterns.
Macro pressure can make the whole picture worse. Higher interest rates and a stronger US dollar usually weigh on risk assets, and Bitcoin often reacts more sharply than stocks or other speculative trades. So when you put election nerves, lower liquidity, and tight financial conditions together, Bitcoin can end up in a rough spot for a while.
What CryptoQuant Thinks Could Happen in 2026
CryptoQuant lays out three possible paths for Bitcoin in 2026. Bearish case carries the highest probability in the report, around 50%. In that setup, uncertainty sticks around, liquidity stays weak, and a short rally in April and May tied to hopes around the CLARITY Act fades out. Bitcoin then moves in a choppy 65,000 dollar to 75,000 dollar range. CryptoQuant calls that a zebra market, meaning price keeps switching direction instead of building a clean trend.
Second path is more balanced. Research gives that one a 30% chance. In that case, post-election clarity helps sentiment, ETF inflows return, and market participation improves. Bitcoin then starts building a steadier climb, with price moving into a 75,000 dollar to 95,000 dollar range.
Most optimistic case has a 20% chance in the report. That outlook depends on clearer rules and friendlier political outcomes. If both arrive, capital could flow back in fast, active participation could rise, and Bitcoin could move into a 90,000 dollar to 120,000 dollar range or even higher.
For beginners, biggest lesson is pretty practical. We should not look at a Bitcoin drop and assume the full cycle is broken. CryptoQuant view suggests midterm years often come with weaker demand first and stronger recovery later. If that pattern holds again, 2026 may stay soft before the election and look healthier after political uncertainty starts to clear.